Automatic extraction of tie points
UltraMap Studio Part #4: Aerial Triangulation
15 September 2022
Measure the position of every object in the image block.
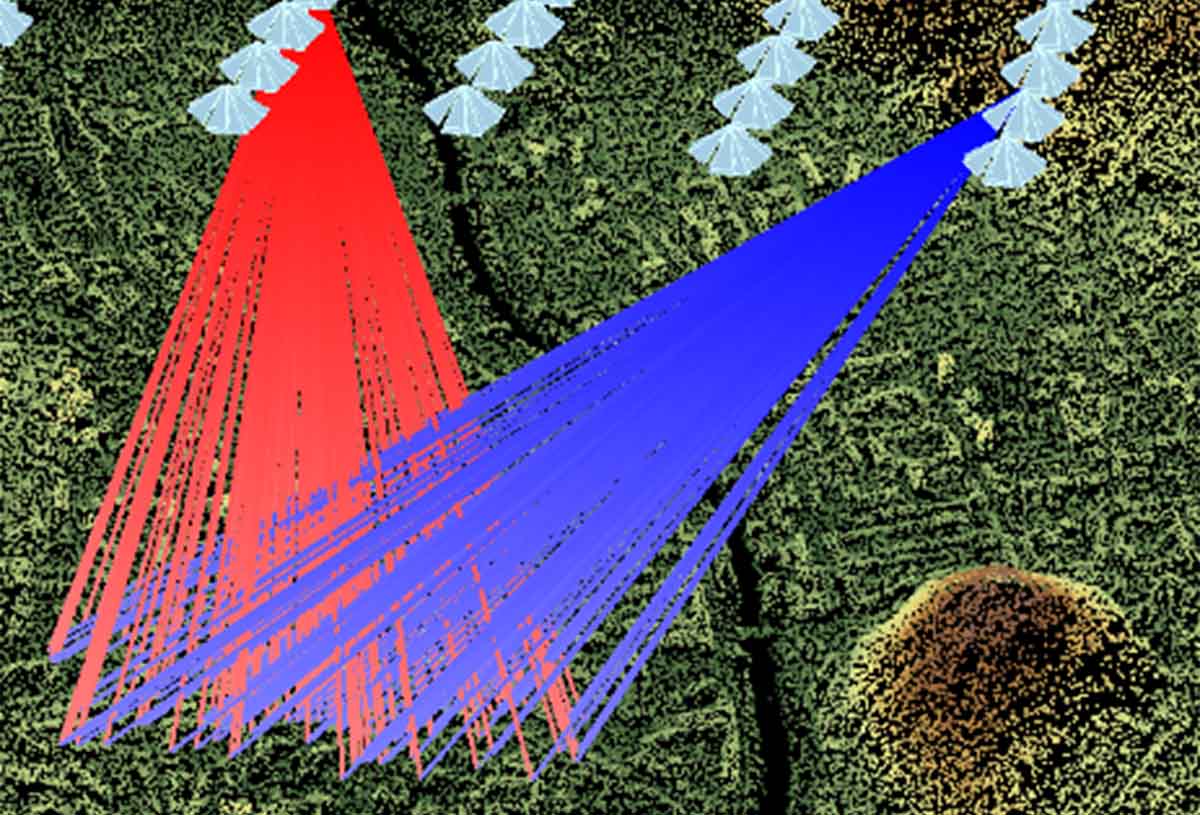
UltraMap collects image relations and tie points automatically using feature extraction and feature matching as well as tie point reconstruction using the extracted nadir and, if available, oblique observations. The resulting linkage and tie point measurements can then be reviewed in the 3D Viewer both for the entire project or only for certain areas of interest.
Measurements for images or points can be visualized as rays.
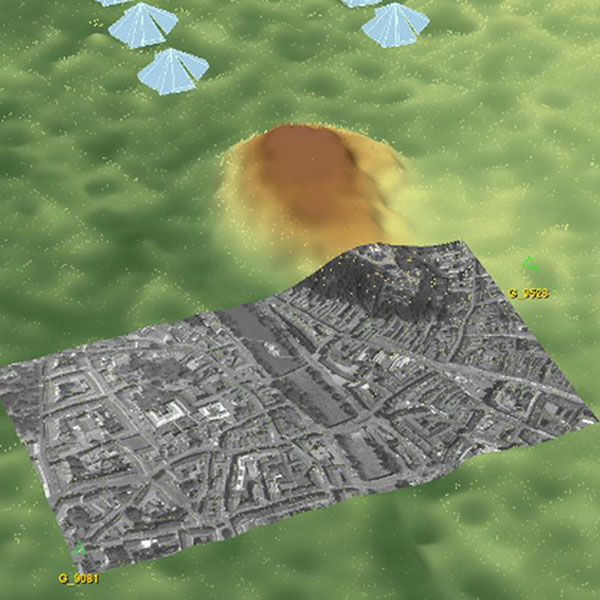
The View Images Mode enables quick image previews projected onto the surface model.
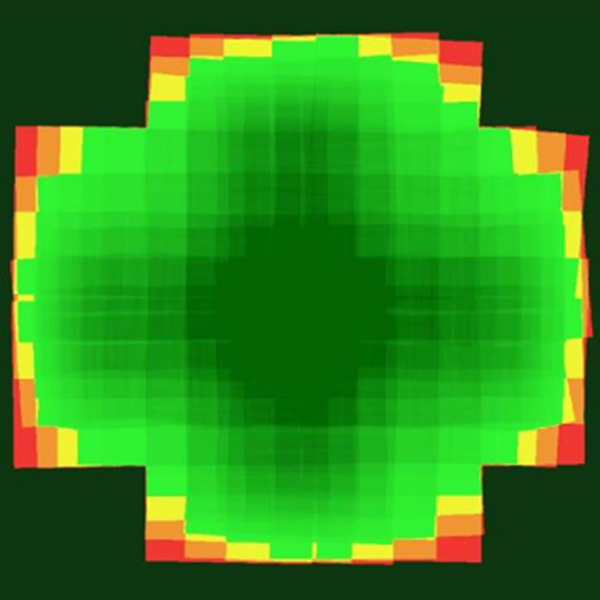
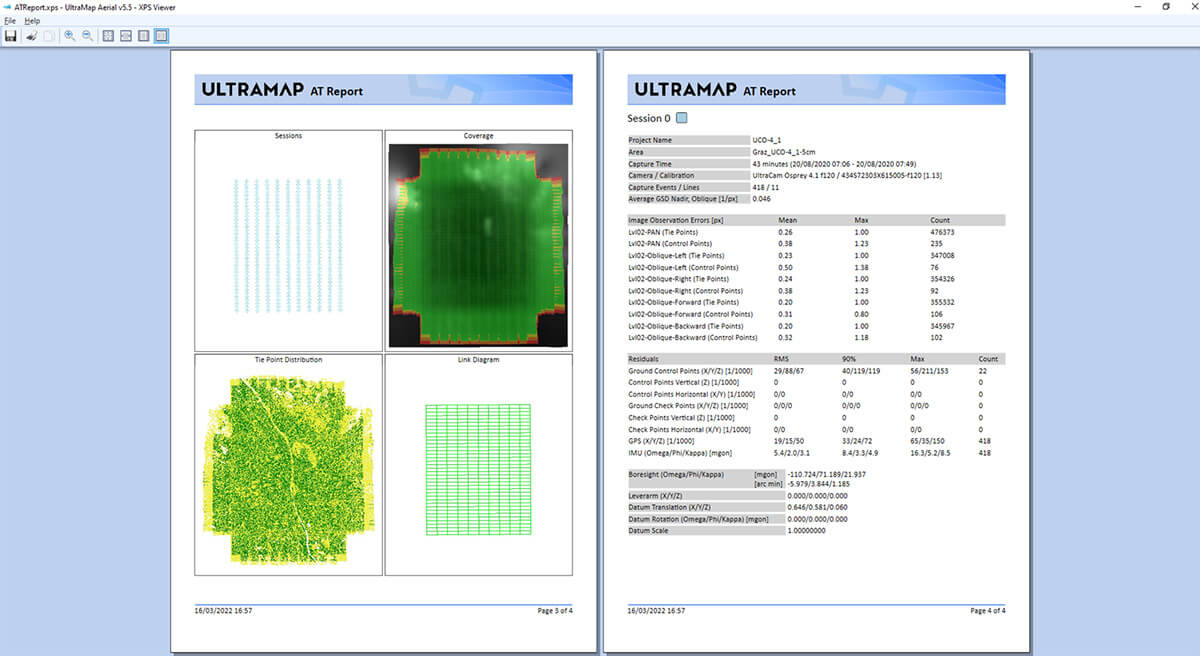
The Coverage View lets you check the overlap of images on the ground. The used color coding is red for a single observation, orange for two observations, yellow for three observations and green for at least 4 observations (the darker the more observations).
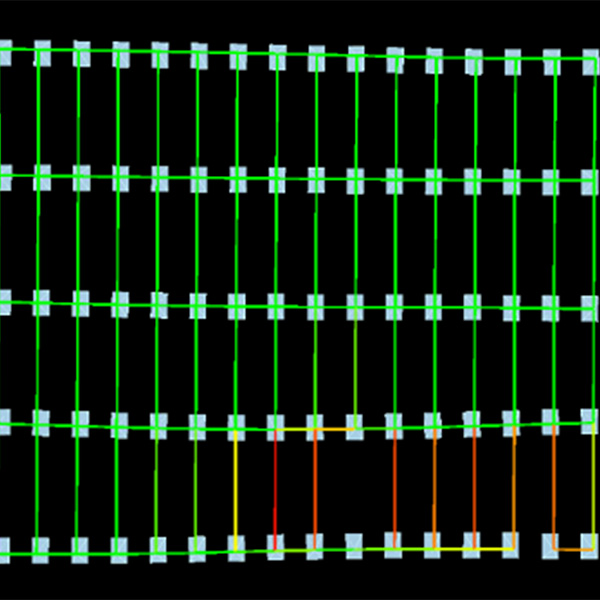
In the 3D Viewer, you can also check the characteristics of the linkage of your captures. There are 4 groups of parameters to choose from:
- Number of links (color coding corresponds to the number of shared tie points)
- Absolute time difference
- Time of day
- Reprojection Error
Here’s how the linkage diagram is visualized based on the number of links:
Measure Control Points within a few clicks
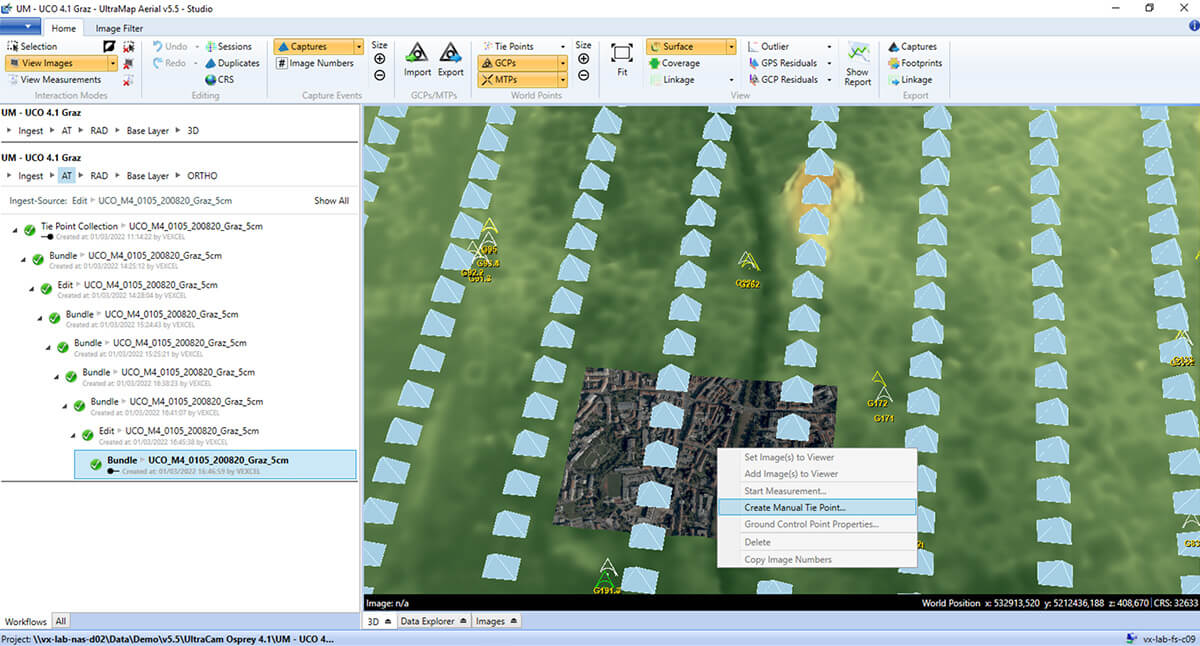
UltraMap has a special mode of operation to perform image measurements of Manual Tie Points (MTPs) or Ground Control Points (GCPs).
Once imported in UltraMap Studio, a control point will be visualized by color-coded overlays in the 3D Viewer. Additionally, a dedicated tab in the Data Explorer shows a summary for each control point. Ground control points can be adjusted in terms of their world position, type, usage or standard deviation.
Manual tie points can be easily created within the 3D Viewer.
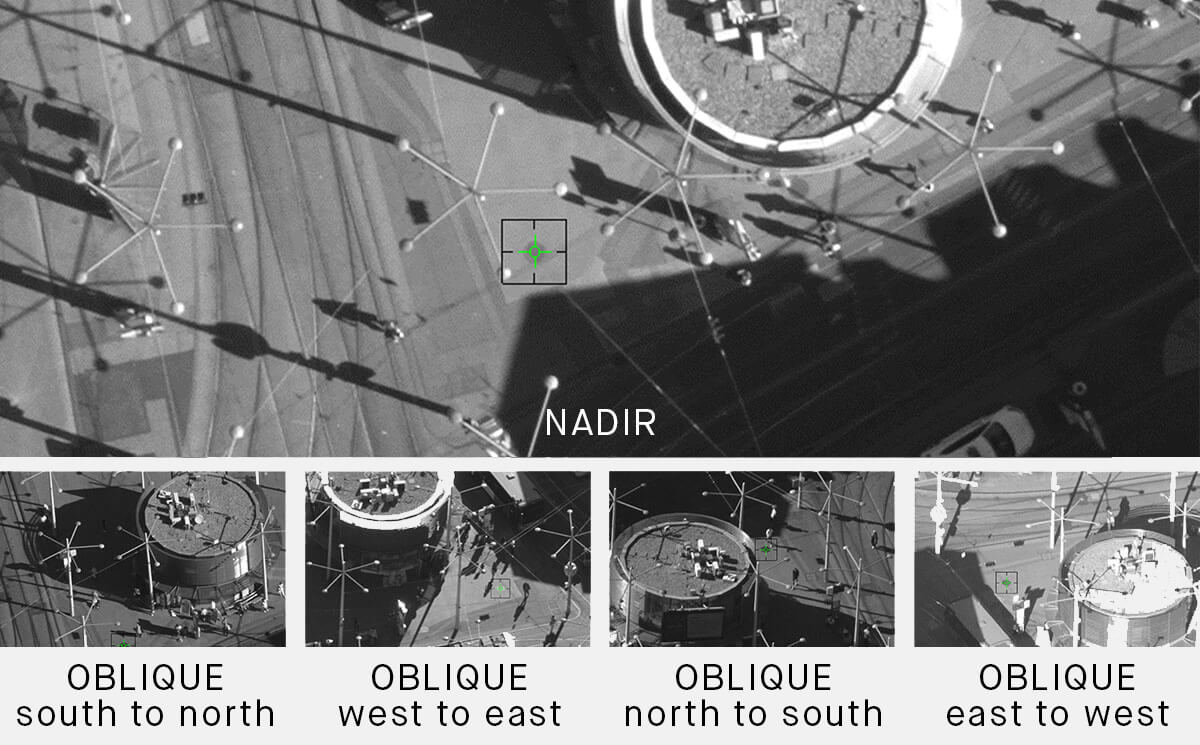
GCPs can be easily measured within the measurement window showing the estimated projection of the 3D point in the image. The projected crosshairs can be simply dragged and dropped to the desired location and will turn from red to green.
UltraMap offers the option of automated completion of similar GCPs to save time.
Bundle Adjustment and Quality Control
The measurements of tie points, ground control points, manual tie points and imported GPS/IMU are input for the bundle adjustment (by means of least-squares adjustment) to calculate exterior orientation parameters for the images. The usage of GCPs, GPS and manual tie points is optional so depending on the requirements of your project, you can choose the ideal configuration.
Once the bundle adjustment is completed, the final step is quality control. The resulting data can be inspected in the 3D Viewer or reviewed and exported in numerical form.
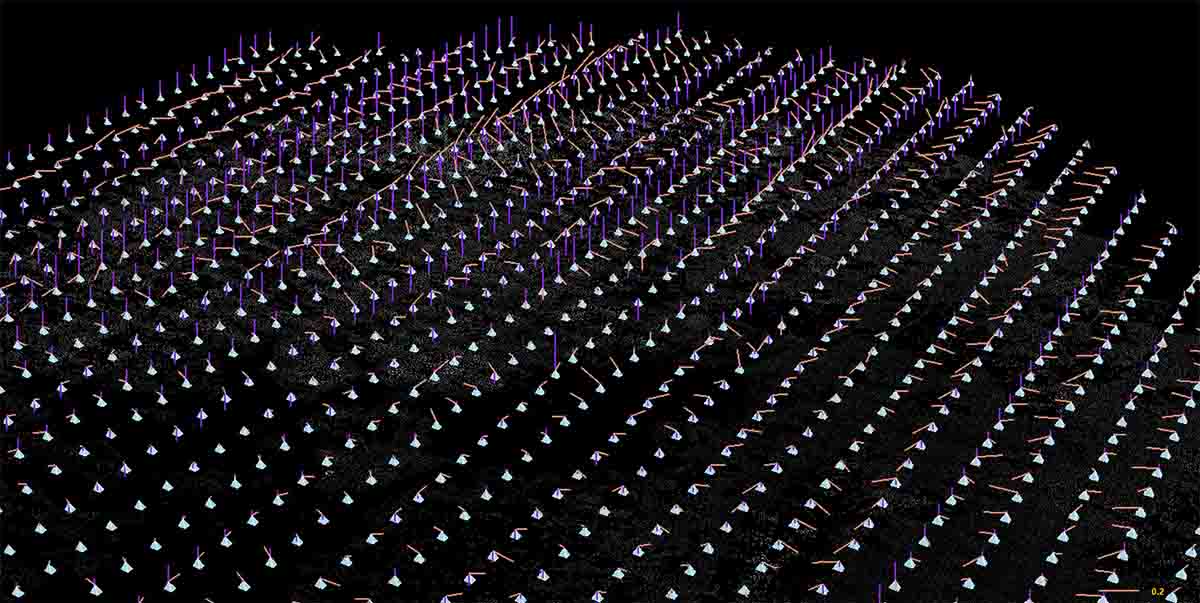
- Residuals
Residuals describe the difference between the originally measured value (GCP measured in the guardrail, GPS position measured during the flight by the aircraft/camera) and the value calculated in the course of the bundle adjustment. So, the smaller the residuals, the closer the bundle solution is to the real world.
Once the data from a bundle run is available, residuals can be displayed in the 3D Viewer. By default, each GPS or GCP residual is displayed as two vectors. One shows the residual in the x-y-plane, the other the altitude residual.
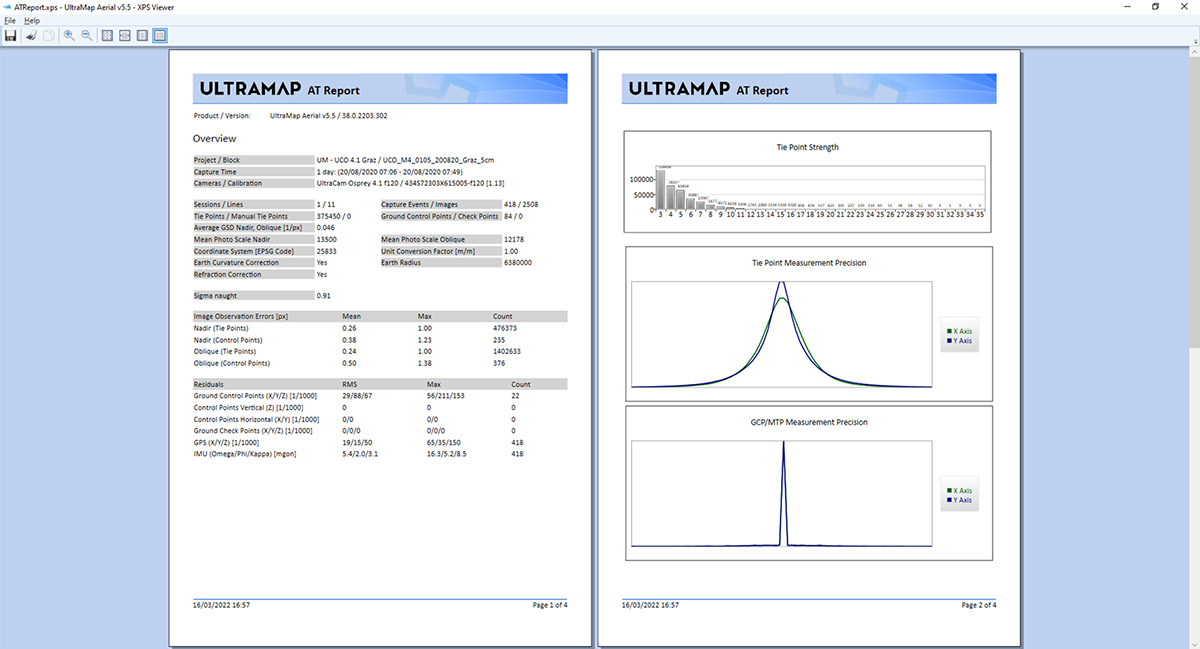
2. AT Report
The AT report can be exported either as a formatted document or as a plain text version, including the following information: basics about the image block, statistics on image measurements and world measurements. While the formatted version includes some plots, the text version includes not only RMS values but also details for single observations.
Our next blogpost will cover the generation of heightfield and ortho products in UltraMap Studio. Stick around!
Want to learn more about UltraMap’s global automated color balancing?
Learn more about Color Balancing